Every sport carries risk — but some carry far more than others. Are you a parent picking safe activities for your kids? An athlete pushing your limits? Or just trying to stay active without getting hurt? Either way, understanding sports injury statistics is useful, not just interesting.
Many organizations working with custom sportswear suppliers now prioritize injury-prevention design elements as part of athlete safety systems.
Most people don' T realize this: the highest injury rates often come from common activities. Extreme sports aren't the only danger.
This ranked breakdown covers the top 10 most injury-prone sports and physical activities . It uses real data — no fluff. You'll see what risks you're actually taking. You'll also learn what you can do to protect yourself before the damage is done.
#1. Tackle Football — The Undisputed Leader in Sports Injury Risk
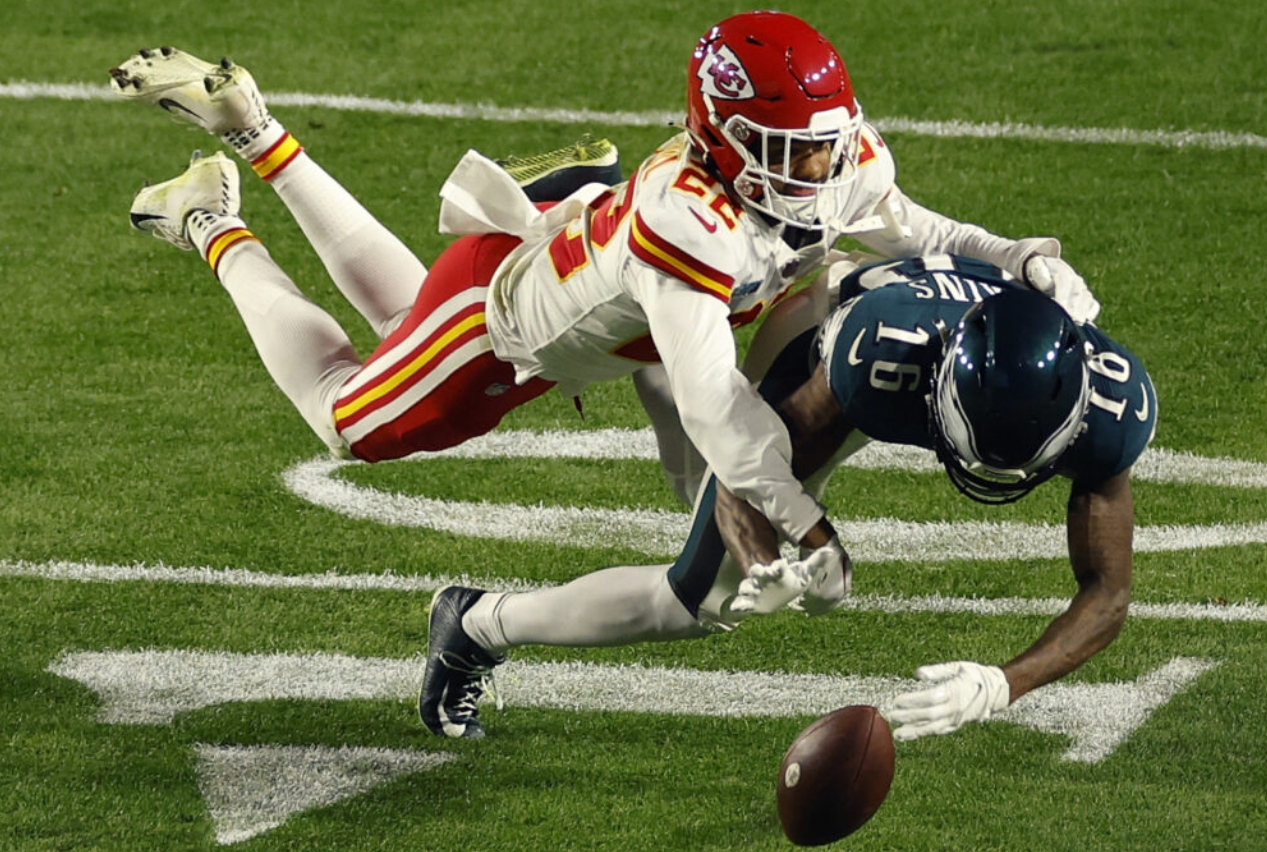
No other sport packs together collision frequency, HEAD -impact volume, and long-term brain risk the way tackle football does. The data makes this clear.Professional teams and clubs increasingly source protective kits through tackle football wear manufacturers focused on high-impact durability and impact-absorbing fabric technologies.
High school tackle football hits 4 . 36–4.74 injuries per 1,000 athlete-exposures (AEs). College players face rates between 3.21 and 8.61 per 1,000 AEs. Compare that to basketball, baseball, and soccer — most land at 1–3 per 1,000 AEs. Football sits at the top of the injury risk chart by a wide margin.
The Head Impact Problem Nobody Talks About Enough
Here's where the numbers get alarming. A CDC instrumented-helmet study found that tackle players absorb 15× more total head impacts than flag football players per session. That includes 23× more high-magnitude impacts (≥40g) . Per season, that adds up to 378 head impacts per tackle athlete — versus just 8 for flag players .
These aren' t just concussions. Repeated subconcussive hits have a direct link to chronic traumatic encephalopathy (CTE). Football accounts for over 80% of lab-confirmed CTE cases in brain bank studies. That's a staggering share.
Where the Injuries Happen
Running with the ball : 32% of injuries
Tackling : 31%
Blocking : 15%
Knees (ACL/MCL tears), shoulders, and head/face each make up 10–20% of total injuries
Tackle football isn't just dangerous in one way. It puts stress on multiple body systems at once — the brain, the joints, and the bones — all in the same game.
#2. Wrestling — High Injury Rate With Hidden Long-Term Risks
Wrestling sits dangerously close to football on the injury risk chart — and most people have no idea.
NCAA men's wrestling records 26.4 injuries per 1,000 athlete-exposures . That's not a typo. It rivals or beats every other college sport tracked. High school wrestlers aren't much safer. They log 13–17 injuries per 1,000 AEs — and on competition days, that number jumps to 30–40 per 1,000 AEs . College soccer sits around 7–9. Basketball, 8–10. Wrestling blows past both.
Many training academies now rely on OEM/ODM Wrestling sportswear production to develop tighter, movement-locked apparel that reduces friction during high-contact grappling.
Where the Damage Accumulates
The injury breakdown in wrestling is very specific:
Knees : 20–25% of all injuries (MCL sprains, ACL tears, meniscus damage)
Shoulders : 15–20% (dislocations, labrum tears — many require 4–6 months of recovery after surgery)
Head/face : 10–15% (concussions, nasal fractures, lacerations)
Skin infections : 10–20% — ringworm, impetigo, herpes gladiatorum — a risk tied directly to wrestling's close-contact nature
The Hidden Risk Nobody Ranks: Weight Cutting
There's another danger in wrestling that goes beyond the mat: rapid weight cutting .
Between 30–70% of wrestlers — from high school to college level — use hard dehydration tactics before weigh-ins. In 1997–1998, three NCAA wrestlers died within weeks of each other from extreme weight-cutting. Heat stroke. Cardiac arrhythmia. Multi-organ failure.
Even "moderate" dehydration of 2–3% body weight cuts strength and power in a way you can measure. At 5%+, blood volume drops. The brain loses its natural cushioning. Concussion risk goes up.
The long-term damage adds up too. Repeated weight-cut cycles connect to hormonal disruption and disordered eating. For adolescents whose bones are still growing, these cycles also link to reduced peak bone mass and higher stress fracture risk later in life .
#3. Soccer (All Genders) — The World's Most Popular High-Injury Sport
275 million registered players worldwide. That scale makes soccer's injury problem impossible to ignore.
Elite clubs and youth academies often collaborate with private label soccer sportswear programs to ensure consistent fit, moisture control, and injury-reducing compression design across age groups.
High school girls' soccer sits at 2.65 injuries per 1,000 AEs — ranking at the top among all female sports. NCAA women's soccer goes even higher during match play, hitting 15–20 per 1,000 AEs in competition. Researchers use 10 per 1,000 AEs as the cutoff for a "high-risk" sport.
The ACL Problem Hits Women Harder
Female soccer players tear their ACL at 2–8× the rate of male players . Several factors drive this gap:
Wider hips create a larger Q-angle, putting more stress on the knee
Muscle firing patterns lean on the quads more than the hamstrings
Hormonal shifts during the menstrual cycle change how stiff the ligaments are
Artificial turf locks the foot during sharp cuts, adding more torque to the knee
Sharp cuts, quick stops, and landing from headers — these are the exact moves that push the ACL past its limit.
Concussions: A Paradox Nobody Expected
Female players take fewer head impacts than males — yet they get diagnosed with concussions at a higher rate . Weaker neck muscles and hormonal differences both play a role. For teen girls aged 14–18, concussions make up 11.7% of all soccer-related injuries .
Heading the ball over and over connects to small white matter changes visible on MRI scans. Those findings are serious enough that many youth soccer groups have banned heading for players under 11.
#4. Gym & Exercise Equipment Activities — The Everyday Risk Most People Ignore
468,000 emergency room visits in a single year. Gym equipment caused that in 2019 — and that was before pandemic-era home fitness took off and pushed those numbers even higher.Many fitness brands now optimize safety-focused apparel through Gym wear & Exercise Equipment wholesale price supply chains to make protective, durable training gear more accessible across entry-level users.
The gym feels safe. It's not a football field. Nobody's tackling you. But that false sense of safety is the real problem.
The Equipment That Sends People to the ER
Treadmills alone caused 24,400 emergency visits in 2019. Most of those incidents were easy to avoid. People looked at their phones mid-run. They skipped the safety clip. They jumped back onto a belt already spinning at 10+ km/h. Over one 10-year CPSC review, 30 treadmill-related deaths occurred. Most came from falls that caused head and neck trauma.
Free weights paint a similar picture. They account for 55–70% of injuries among people who lift. Sprains and strains in the shoulders, lower back, and knees make up 40–60% of those cases. Unsupervised bench press stands out as one of the most reported fatal gym accidents.
Who Gets Hurt — And Why
Beginners get hurt from bad technique. Advanced lifters get hurt from ego. Both groups miss the slow, hidden damage. It builds over months. Then a tendon tears or a disc herniates — and suddenly the damage becomes impossible to ignore.
A proper warm-up cuts acute soft tissue injuries by 30–50% . That's a big payoff for just 10 minutes of effort.
#5. Bicycling — Highest Absolute Injury Numbers in the U.S.
Forget extreme sports for a moment. The activity sending more Americans to the emergency room than basketball, football, and soccer combined is something most people do for fun or their morning commute.
Bicycling caused 859,696 ER-treated injuries over 2023–2024 — about 430,000 per year . That works out to an injury rate of 133 per 100,000 participants . It's the highest total injury count of any sport tracked in U.S. NEISS-based research. No other sport comes close.
Where the Body Takes the Hit
The injury pattern follows a simple physics problem — people falling at speed:
Upper extremities (hands, wrists, forearms, shoulders) : 30–40% of all injuries. Riders throw their arms out during falls. It's a natural reaction. Distal radius fractures alone make up 10–15% of all bicycle-related fractures.
Lower extremities (knees, ankles, legs) : 25–35% of injuries — mainly contusions, sprains, and abrasions from side falls.
Head and face : 15–20% of diagnoses — but they account for a far larger share of ICU admissions and fatalities than that number suggests.
Road rash and soft-tissue injuries : these top 50% of all ER visits combined.
In 2023, 1,377 cyclists died — 1,155 of those in motor-vehicle crashes. That's the highest number on record.
The One Variable That Changes Everything
Helmets cut serious brain injury risk by 60–85% . That one number makes wearing a helmet non-negotiable. High-visibility gear adds another layer of protection. Meta-analyses show 30–50% lower collision risk for cyclists wearing bright clothing with lights, compared to dark gear with no lighting. Two simple choices — helmet and visibility — cover most of the risk.
#6. Basketball — 26% of All Sports Injuries Come From This One Sport
Basketball doesn't look dangerous. No helmets. No tackles. Just a ball, a hoop, and sneakers. That casual image is exactly what makes it so deceptive — it sends 4.4 million Americans to seek medical care every single year .
The numbers are hard to ignore. Basketball accounts for 26% of all sports injuries across every tracked sport. That's more than any other single activity on this list. In real numbers, that's 570,000 emergency room visits per year , with over 8,000 serious enough to require hospitalization.
Where Basketball Breaks the Body
The injury pattern is consistent and well-documented:
Ankle sprains : The #1 culprit. 49% of all basketball sprains hit the ankle. Most happen from landing on another player's foot mid-jump
Knee injuries (ACL, meniscus) : Knees take up to 45% of injuries in some player groups. Female players tear ACLs at much higher rates than male players
Jammed fingers : Ball-to-fingertip collisions cause ligament tears and small fractures. Players often don't report these
Concussions : Elbow contact during rebounding and hard floor impact after aerial falls are the two main causes
Amateur recreational players — adult men in unorganized pickup games on outdoor courts — rack up more ER visits than professional players. No coaching. No proper warm-up. No ankle bracing. That combination produces injuries at a predictable rate.
#7. Rugby & Lacrosse — Contact Sports With the Longest Recovery Times
Two sports. One shared problem: get hurt, and you're out for a long time.
Rugby's recovery data tells a brutal story. World Rugby's research confirms that muscle damage takes five full days to clear after a match. Creatine kinase — a direct marker of muscle breakdown — spikes 352% at 24 hours post-match . It stays elevated for 120 hours . That's five days of biochemical proof your body is still in repair mode.
Men's lacrosse hits differently. 16.1% of all time-loss injuries in NCAA men's lacrosse go beyond three weeks . That's the highest share among all tracked men's college sports. Concussions, ACL tears, and shoulder dislocations are the main culprits.
Why Recovery Takes So Long
Both sports mix high-speed collisions with explosive cutting movements. Rugby averages 150–200 contact events per team per game . Lacrosse lands fewer hits, but each one carries far more individual impact force.
Your joints take the brunt. So do your muscles and nervous system. Together, they need more time to rebuild than in almost any other sport on this list.
#8. Ice Hockey — Concussion Capital of Winter Sports
Ice hockey has a concussion problem. The sport has never fixed it.
In junior hockey (ages 16–21), 25.3% of players got a concussion in a single season . One in four. That's not an outlier — it's the baseline. At the youth level (ages 12–18), concussions make up ≈15% of all injuries . Some datasets put hockey's concussion rate higher than tackle football in children.
The NHL numbers show the trend is getting worse, not better. Concussion rates climbed from 6.1 per 100 games (2006–2010) to 8.3 per 100 games (2014–2019) — a 36–40% increase .
Why the Ice Makes Everything Worse
Three things drive hockey's high concussion rate:
1.Board collisions : Players hit hard, rigid boards at high speed. The stop is sudden and brutal. Even after Rule 48, 63.3% of NHL concussions still happen at the perimeter.
2.Open-ice body checks : Shoulder-to-head contact is still the top cause of concussions. Targeted rule changes haven't stopped it.
3.Ice-surface falls : Ice is hard and slippery. It speeds players up faster than grass or a court. So head impacts on the ice hit harder than on other surfaces.
Among youth players, 43% of concussions came from illegal contact . Stricter rule enforcement alone could cut those numbers by a large margin.
Long-term, the risk keeps building. BU research found that each extra year of hockey play raises CTE odds by 34% .
#9. Volleyball — The Fastest-Growing Injury Sport of the Decade

Volleyball has a branding problem. Everyone sees it as the "safe" sport. It's not.
Between 2013 and 2022, 347,395 adolescents ended up in U.S. emergency departments with volleyball injuries. That's close to 35,000 kids per year — and participation keeps climbing. Girls' high school volleyball grew 15% since 2002 . That makes it the second most popular sport among young females . More players means more injuries. The math is simple.
The Injuries Nobody Sees Coming
1.Ankle sprains : The #1 issue. They cause 21.7% of all time-loss injuries in women's volleyball. Most happen from landing on a teammate's foot near the net.
2.Lower extremity injuries : 40.8% of all adolescent volleyball ER visits target the legs and knees.
3.Shoulder damage : 93% of professional players reported knee, back, or shoulder complaints in a single season.
Here's the hidden stat: indoor volleyball runs a 5.3 injuries per 1,000 hours rate. That's 3× higher than beach volleyball's 1.8. Same sport. Two very different risk profiles.
Outside hitters and middle blockers take the most physical damage. High jump volume, repeated net landings, and constant overhead spiking all build up overuse injuries over time. These injuries stack up in the background — until the body gives out.
#10. Track & Field & Running — Overuse Injuries That Sneak Up on You
Running looks innocent. No opponents. No collisions. Just you, the track, and your own two feet. But over 50% of regular runners suffer at least one injury per year — and 80% of those injuries come from overuse , not accidents.
Male high school track athletes record 7 injuries per 10,000 athlete-exposures . That puts them near the top of all youth sports. Injury rates have also climbed +28.4% in a single recent season .
The Four Injuries Building in the Background
1.Shin splints → stress fractures : It starts as a dull ache after long runs. Feels manageable at first. Then the bone cracks.
2.Achilles tendinopathy : Morning stiffness that "warms up" and fades mid-run — until one day it doesn't go away.
3.Patellar tendinitis ("jumper's knee") : Pain at the kneecap during downhill runs and sprint finishes. Weak glutes push extra load onto the knee, and that's where it shows up.
4.Hamstring/calf strains : A tight feeling in those final 200m sprints. It builds slowly, then snaps into a Grade II tear.
The 10% Rule — and Why It's Not Enough
Push your mileage up by more than 30% in a short training block, and injury risk jumps 1.5–2.5× . The classic advice — never add more than 10% per week — gives you a starting point, not a safety net. Move to harder surfaces or add intervals, and tissue stress goes up even with the same total mileage .
The fix is straightforward. Take one deload week every four weeks. Cut volume and intensity by 20–40%. That's the window where bone and connective tissue repair and rebuild. Skip it, and the damage keeps stacking.
Sports Injury Risk Comparison: Side-by-Side Data Breakdown
The same sport can look like a totally different risk depending on what you measure. That one shift changes how you read all injury data.
Here's the problem: most rankings pick one metric and stop there. But injury risk has three distinct dimensions — and each one tells a different story.
Sport | Injuries/1,000 AEs (High School) | Injuries/1,000 Hours | Concussion Risk | Absolute ER Volume |
|---|---|---|---|---|
Tackle Football | 3.96 — highest tracked | High | Highest (contact sports = 45% of youth TBI) | Very High |
Girls' Soccer | 2.65 | 0.04–75.8 (varies) | Above average | Very High |
Wrestling (M) | 2.36 | Moderate-High | Moderate | Medium |
Basketball | 1.5–2.5 | Moderate | Higher for females | Highest absolute |
Ice Hockey | Not ranked by AE | 127.3 — highest recorded | Highest per hour | Low (small participation base) |
Volleyball (F) | 1.0–1.8 | Low | Low | Medium |
Baseball/Softball | <1.5–2.0 | Low-Medium | Low | Medium-High |
Three separate rankings come out of this data, based on what you measure:
Per-exposure rate : Football → Girls' Soccer → Wrestling
Per-hour intensity : Ice Hockey leads by a wide margin
Raw injury volume : Soccer and Basketball top the list — because far more people play them
Ice hockey shows this gap most clearly. Its 127.3 injuries per 1,000 hours beats every other sport on that list. Yet it barely shows up in total ER numbers. Why? Participation is a small fraction of soccer or basketball. Basketball, on the other hand, accounts for 26% of all tracked sports injuries in raw numbers. Not because each session is more dangerous — but because millions play it every week.
Concussion risk runs on its own scale. Football and hockey lead in rate. Yet girls' soccer and girls' basketball rank above their male versions. Female athletes take concussions at 1.2–1.8× the rate of males playing the same sport.
Pick the metric that fits your situation. Parents looking at contact sports should focus on concussion rate. Coaches tracking training loads should watch per-hour exposure. Public health researchers need absolute numbers. Same data set. Four different right answers.
How to Reduce Your Injury Risk: Sport-Specific Prevention Strategies
The research is clear: structured prevention programs cut lower-limb injury risk by 37% across soccer, basketball, and handball. Another study found 47% fewer overuse injuries among athletes who followed exercise-based prevention plans. These aren't small gains — they're massive.
Here's what works, broken down by sport type.
Contact Sports (Football, Wrestling, Hockey)
Gear compliance isn't optional. Well-fitted helmets, pads, and braces are proven tools for reducing outside risk factors. Pair that with:
Preseason strength and conditioning
Neuromuscular control training
Collision-technique drills (footwork, body positioning, balance)
Equipment checks before every session
In youth hockey, rule changes around body-checking have served as a direct injury-control strategy.
Cut, Jump, and ACL-Risk Sports (Soccer, Basketball, Volleyball)
The best intervention here is a neuromuscular warm-up . Skip static stretching — it shows zero preventive effect. Build your routine around:
Single-leg balance work
Jump-landing mechanics
Deceleration and cutting drills
Hip and core strengthening
FIFA 11+ is the gold-standard program for this. Teams that use it see close to one-third fewer lower-limb injuries .
Gym, Cycling, and Running
One rule applies to all three: technique before load . Never push intensity to cover for poor form. Runners need gradual mileage builds, planned deload weeks, and workload tracking. Gym athletes should focus on core strength, mobility, and cross-training. Spreading stress across different muscle groups and tissue types keeps overload in check.
Who Is Most at Risk? Age, Gender & Experience Level Breakdown
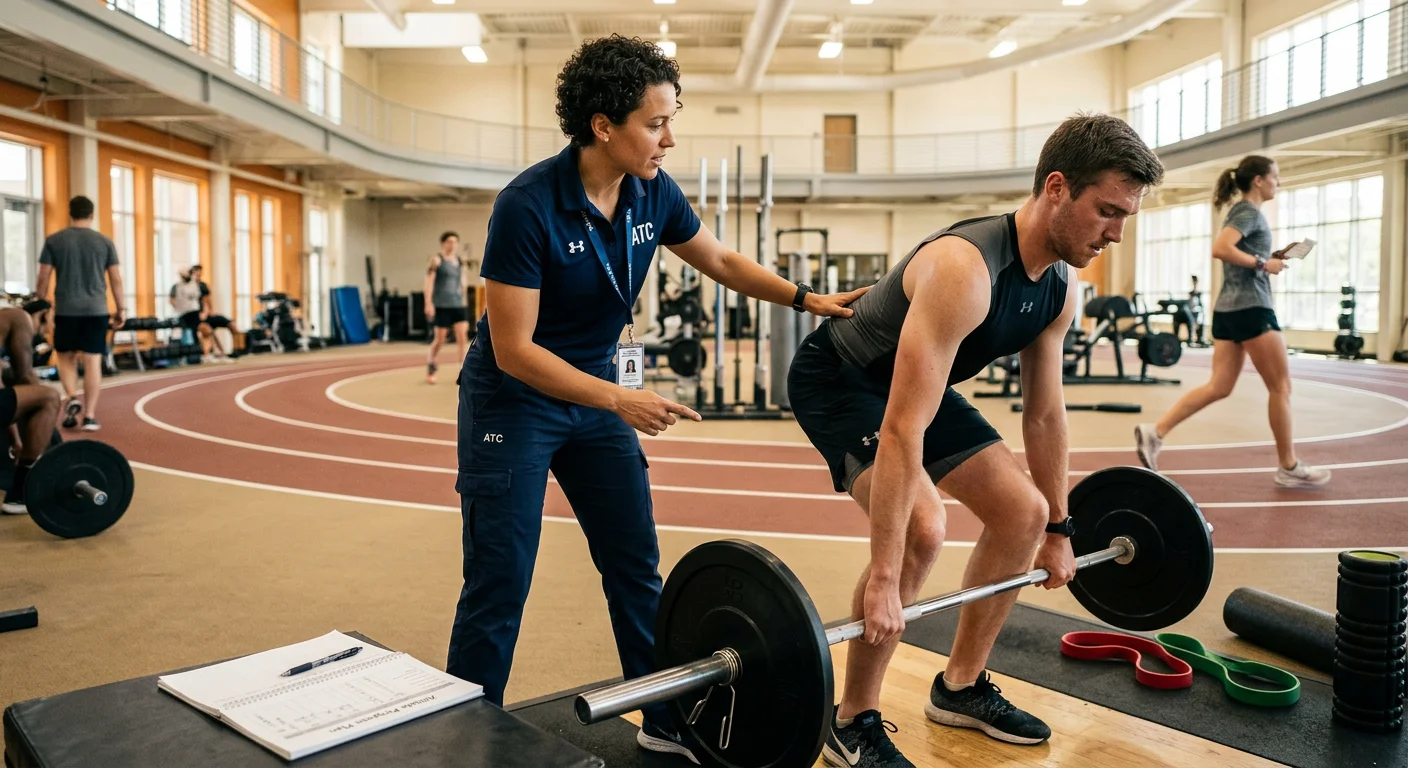
Injury risk isn't random. It clusters around specific groups in clear, data-backed patterns.
Female athletes aged 13–25 carry the highest ACL risk of any demographic. In pivoting sports like soccer, basketball, and handball, women tear their ACL at 2–8× the rate of males . Biomechanics explain most of this gap. Female athletes land with 5–10° more knee valgus and produce 2–3× higher knee abduction moments than males doing the same movements. Hormonal factors make it worse — estrogen reduces ACL stiffness and can cut ligament fibroblast growth by 40–50% . That combination raises vulnerability fast.
Age sharpens the picture further:
Adolescents (boys 12–15, girls 10–13) : Growth plates are weaker than surrounding tendons. Up to 30% of all fractures in this group hit the growth plate — common in gymnastics, baseball, and distance running.
Adults 35–55 : Degenerative meniscal changes show up in 20–30% of MRI scans. A prior ACL injury raises osteoarthritis risk by 3–10× .
Adults 65+ : Falls cause 95% of hip fractures . Women over 75 face serious fall risks that exceed 30–40% each year.
Experience level creates its own risk curve — and it's not linear.
Novice runners rack up 20–30 injuries per 1,000 hours in early training. Experienced runners? Just 2–12 . But the most underestimated group is the overconfident intermediate — weekend warriors with 1–3 years of experience who bring moderate skill, high effort, and no structured conditioning at all. Intermediate skiers show 2× the ACL rate of experts at the same exposure level. You see the same pattern across recreational soccer and basketball leagues.
The highest-risk profile, put simply: young female athlete, competitive but not professional, no prevention program in place .
Conclusion
Every sport carries risk — but not all risks are created equal.
Tackle football brings brutal injury rates. Runners deal with sneaky overuse damage that pulls them off the track. The data points to one thing: knowing your sport's risk profile keeps you in the game longer. You might be a parent picking your child's first team sport. Or you're an athlete pushing your limits. Either way, these injury statistics aren't here to scare you off the field — they're here to keep you on it.
The smartest athletes don't just train harder. They train smarter . That means the right technique, the right recovery habits, and the right gear protecting their body through every rep, sprint, and collision.High-performance programs increasingly integrate OEM/ODM sportswear solutions into their training systems to align protection, mobility, and durability.
So here's your next move:
1.Find which high-risk athletic activities fit your lifestyle
2.Go back to the sport-specific prevention strategies in this guide
3.Check your protective equipment before your next session
Your performance depends on the body carrying it. Take care of that body first.