Table of Contents
The women's cycling apparel market is growing fast. But many riders still struggle to find gear that fits right—both in size and style.
Maybe that's why you're here. You're launching a cycling brand, outfitting a women's team, or adding a custom line to your store. You've spotted a gap that needs filling.
Here's what you need to know about designing custom women's cycling uniforms. It's not just about making men's designs smaller and picking nicer colors.
The process needs real attention to detail. You need female-specific ergonomics. You need performance fabrics that work. You need sublimation printing that stays bright after fifty washes. And you need manufacturers who understand moisture-wicking fabric—what it should do during a four-hour ride.
This guide takes you through the whole process. You'll go from sketching your first women's bike jersey to getting production-ready samples. We cover the technical details. We explain budget realities. We show you the decision points that turn your vision into padded cycling shorts women want to wear, mile after mile.
Selecting Performance Fabrics for Women's Cycling Kits

Fabric choices make or break cycling gear. A jersey that traps heat during a climb? Shorts that stay damp after the first ten miles? That's distraction, not comfort.
Women's bodies regulate temperature in unique ways. Sweat patterns differ. Fit requirements change. Your fabric needs to work with these realities, not against them.
The Science Behind Performance Fabrics
Real data shows why fabric matters. Researchers tested 12 endurance athletes in a 20-kilometer time trial. Half wore synthetic blends (60% polyester, 40% nylon). The other half wore cotton.
The results? Synthetic-blend riders finished 15.7 seconds faster—a 0.8% improvement. In the final six kilometers, their speed increased by 0.98 km/h. Power output jumped by 18.4 watts. Their skin temperature stayed about 1°C cooler throughout the ride.
Performance Stats CardsEven more telling: 80% of riders said they felt better performance in synthetics. 83% described the gear as "lighter, cooler, drier, more moisture-wicking."
That's the gap between feeling strong at mile 18 and counting down minutes until you're done.
Top Fabric Technologies Worth Knowing
Polartec Delta uses bi-component knit construction with raised yarns. The result? Better ventilation. Better moisture control. Dry zones target high-sweat spots—right where women need them during hard rides.
Outlast takes a different approach. It cuts sweat by up to 48% . Body temperature drops by 8% . The fabric grabs heat during hard efforts. Then it releases that heat as you cool down. Think of it as built-in climate control for long, sweaty rides.
Gore-Tex Active packs 9 billion microscopic pores per square inch . Each pore is 20,000 times smaller than a water droplet. Yet it's 700 times larger than water vapor. Translation: rain stays out, sweat escapes. The C-KNIT® backer keeps it comfortable against skin. Full waterproof protection stays intact.
Recycled polyester (rPET) delivers performance and sustainability. It uses 59% less energy than traditional polyester. You still get the same quick-drying, moisture-wicking properties. For brands building an eco-conscious identity, rPET makes sense.
Merino wool blends provide natural temperature control. Plus odor resistance. Perfect for multi-day tours or riders who prefer natural fibers.
Nylon blends (often mixed with polyester) add flex and durability. They move with your body through every pedal stroke. Shape stays true.
Matching Fabric to Riding Conditions
Hot, intense rides demand Polartec Delta or Outlast . The cooling properties and moisture management keep core temperature stable. Sun beating down? No problem.
All-weather riding? Gore-Tex Active handles rain, wind, and temperature swings. No bulk like traditional rain gear.
Everyday training and eco-conscious positioning work well with rPET fabrics. They perform well. Your brand's sustainability story gets stronger too.
Year-round versatility calls for Merino blends . They regulate temperature in both heat and cold.
Testing Standards That Matter
Don't just trust fabric spec sheets. Test stretch and recovery using ASTM D2594 standards. Put 10 pounds of stretch force on it. Then check width and length recovery. Women's cycling kits need fabrics that bounce back. Garments that stretch out after a few wears? They don't work.
The research data showed synthetic blends had better breathability. Lower water vapor resistance than cotton too. Cotton had better stretch recovery numbers. But performance isn't just one metric. It's how everything works together on the bike.
Your fabric selection shapes rider experience. Choose synthetics over cotton for real performance gains. Match specific technologies to your target rider's needs. Test recovery properties to ensure they last. The best fabric is the one riders stop thinking about. Because it works.
Designing Female-Specific Fit and Ergonomics
Women's bodies aren't smaller versions of men's bodies. That sounds obvious, right? Yet most cycling gear treated female fit as an afterthought—shrink it, pink it, done.
The numbers tell a different story. Research from Treaster & Burr found that women show higher rates of muscle and bone disorders in shoulders, neck, and upper limbs compared to male cyclists. The cause? Gear designed around male body data.
Here's the problem: design for "average," and you design for nobody. Think about it. A rider might hit average height but have shorter arms and a longer torso. Or average torso length but wider hips and narrower shoulders. Those combinations matter on the bike.
The 5th to 95th Percentile Rule
Smart ergonomic design targets the 5th percentile female through the 95th percentile male . This range covers about 80% of all riders . It's your foundation.
But women's proportions differ in ways that change everything about fit:
Shoulder width : Narrower in most cases. This means adjusted strap placement on bib shorts women want to wear.
Torso length : Often shorter. Different jersey hem length prevents ride-up.
Hip-to-waist ratio : Greater in most women. Chamois positioning needs to avoid pressure points.
Q-angle : The angle from hip to knee differs. This affects how padded cycling shorts for women should be cut through the leg.
Critical Measurement Points
Focus your pattern development on these body combinations:
Buttock height determines where your chamois sits during the pedal stroke. Too high? Chafing. Too low? Pressure in all the wrong places.
Buttock-to-knee length shapes how bib straps distribute tension. Get this wrong and you create shoulder fatigue during long rides.
Shoulder breadth dictates armhole placement and sleeve attachment. Too wide and you get fabric bunching. Too narrow and you restrict breathing.
One study reviewed 41 furniture ergonomics papers. Two used gender-segregated data . Cycling apparel can't make that same mistake. Gear that doesn't match body dimensions causes back pain, shoulder strain, and neck tension. European data shows 38.1% of occupational diseases stem from work-related muscle and bone disorders. Women face this more and more.
Real-World Application
Think of a 4'11" rider. Standard jerseys designed for 5'5" women create excess fabric. Arm holes sit too low. Sleeve length extends past wrists. The result? Discomfort that builds over miles.
Now imagine your bib shorts. Straps designed for a 5'8" torso pull on a 5'2" frame in the wrong way. They dig into shoulders. They create tension across the chest. After 30 miles, that rider's thinking about pain, not performance.
The solution isn't one-size-fits-most. Adjustability or expanded size ranges fit real bodies. Your size run should reflect actual female body distribution—not a male template scaled down.
Use these measurements to inform fit testing. Build samples across your size range. Test them on riders matching those percentiles. Listen to what they tell you. The chamois shifts. The sleeves bind. The neckline cuts wrong.
Female-specific ergonomics isn't about making things pretty. It's about making things work.
Creating Visual Design and Branding Elements
Your jersey appears on a crowded start line. Does it disappear into a blur of patterns? Or does someone across the pack notice it and think, "I need to ask about that kit"?
Visual design isn't decoration. It's your fastest communication tool. 93% of purchasing decisions hinge on visual appearance. Riders form an opinion about your brand in 0.05 seconds . 55% of that judgment comes from what they see.
Color Psychology on Two Wheels
90% of snap judgments about products come from color alone. That matters for your palette.
Bright, saturated colors signal energy and speed. Think electric blues, hot pinks, vivid oranges. Racing teams and performance brands use these well. They also boost visibility on the road—a safety bonus.
Pastels and muted tones suggest sophistication. They suggest everyday wearability. Lifestyle brands targeting recreational riders use these. These riders want gear that works from bike path to coffee shop.
Here's what matters: consistency . Brands with coherent visual identity see 33% higher revenue . Pick your core colors—two to three works best. Stick with them across every touchpoint. Your website. Your packaging. Your social posts. Your jerseys.
Logo Placement That Works
60% of Fortune 500 companies use combination logos—both symbol and text. For cycling apparel, you need versions that scale. A detailed logo looks sharp on your website. Shrink it onto a jersey chest, and details vanish at speed.
Create these versions:
Primary logo : Full detail for large applications
Secondary mark : Simplified icon for small spaces
Wordmark : Text option for narrow placements
Test each version at real size on fabric samples. What looks clear on screen can blur in sublimation printing. Ask: Can someone identify this logo from 20 feet away during a group ride?
Placement zones that work:
Chest center : High visibility, traditional
Sleeve : Modern, doesn't compete with sponsor logos
Lower back pocket area : Visible to riders behind you
Hip/side panel : Unexpected, memorable
Pattern and Graphic Elements
Stock graphics feel... stock. Custom visuals perform 7x better than generic imagery. Your patterns should tell your brand story.
Targeting mountain bikers? Organic, flowing lines can reference trail contours. Road racing focus? Clean geometric patterns suggest speed and precision. Gravel adventurers? Topographic elements or abstract terrain shapes create connection.
65% of people remember visual content three days later versus 10% for text alone . Your graphics need to stick in memory. Avoid complexity that reads as visual noise. Bold, confident shapes work better. Fussy details disappear in sublimation.
Consistency Across Every Piece
71% of companies report that inconsistent visuals confuse customers. Your bib shorts, jersey, arm warmers, cap—they should feel like a set. Not identical. But related.
This doesn't mean everything gets the same pattern. It means shared DNA. Keep color ratios consistent. Repeat graphic motifs. Use unified typography. Someone sees your vest separate from your jersey? They should still recognize your brand.
73% of consumers trust brands more with consistent visual identity. That trust converts to sales.
Finding and Evaluating Custom Cycling Uniform Manufacturers
The custom cycling clothing market hit USD 698.31 million in 2024. By 2032, it'll reach over a billion at 8.96% annual growth. This growth brings opportunity. It also brings noise.
Market Stats CardsHundreds of cycling apparel's manufacturers claim they can deliver your vision. Some excel at performance textiles. Others master digital customization. A few do both. Most fall short on at least one key point.
Your job? Cut through marketing claims. Find the partner who matches your specific needs.
Start With Your Non-Negotiables
List what you need before you contact anyone:
Minimum order quantity : Can you commit to 100 units? Or do you need a manufacturer who works with orders under 50? Digital printing technology made low-volume orders possible. But not every factory invested in it.
Customization depth : Logo placement? Full custom graphics? Fit adjustments? Material selection control? Define your level.
Timeline pressure : Corporate events and team launches have fixed dates. A manufacturer promising 6-week lead times sounds great. Then you learn their "lead time" starts after final approval. That takes another 3 weeks.
Budget reality : Entry-level polyester blends run one price tier. Special moisture-wicking fabrics cost more. Know your number before conversations start.
Platform Research That Works
Online brand sites show you capabilities. But they don't reveal production realities.
Check specialty retailer partnerships of cycling apparel . Manufacturers supplying established cycling shops have proven quality systems. They've passed someone else's vetting.
Dig into digital customization portals . Champions Systems and Nike built platforms that let you preview designs in real-time. These systems show serious investment in customer experience. They also speed up approval cycles.
Verify 3D body-scanning integration . This tech reduces return rates below 5% by optimizing material usage and fit. A manufacturer offering it is committed to precision.
The Manufacturer Hierarchy
Premium tier (Assos, Rapha, Castelli): Custom fabrics. Luxury positioning. Best for brands targeting serious racers willing to pay for performance edges. Expect higher MOQs and premium pricing.
Performance-focused (Endura, Giordana, Santini): Rugged durability meets technical innovation. Strong for MTB or all-weather gear. Mid-range pricing with reasonable minimums.
Digital-first (Champion System, Pactimo): Group order specialists. Their platforms handle team customization well. Lower MOQs work for clubs and corporate orders. Quality stays consistent.
Regional specialists : China/Vietnam/India factories offer export-competitive pricing. Quality varies. Sample testing becomes critical. Japan and South Korea cycling apparel's manufacturers bring e-commerce know-how.
Testing Standards You Can't Skip
Request samples before committing. Test them against clear benchmarks:
Air permeability : Use ASTM D737 standards. Look for readings above 100 CFM . Anything less traps heat.
UV protection : UPF 50+ rating minimum. Summer rides demand it.
Wash durability : Sublimation printing should survive 500+ washes without fading. Ask for wash-tested samples, not fresh-off-press versions.
Fabric weight : Road jerseys work best at 150-200 GSM . Heavier fabrics ( 200-250 GSM ) suit cooler conditions or MTB uses.
Red Flags Worth Noticing
Vague timelines signal weak project management. "4-6 weeks" becomes 10 weeks once problems surface.
Resistance to sharing previous client work suggests limited experience. Or quality issues they'd rather hide.
No mention of counterfeit prevention measures? That's a problem. The industry battles knockoffs that damage brand reputation and rider safety.
Unwillingness to provide fabric specs or test certifications means they're reselling, not manufacturing. You want the source.
Building the Right Partnership
North America accounts for over one-third of global demand. Manufacturers serving this market understand rapid delivery expectations and digital convenience.
Asia-Pacific factories drive the fastest growth. Their cost advantages are real. But communication gaps and longer shipping times require extra planning buffer.
The best cycling apparel's manufacturer for your brand depends on your specific mix of volume, customization depth, timeline, and budget. Match those needs to manufacturer strengths. Test samples well. Start with a smaller trial order. Then scale once you've verified quality and reliability.
Your manufacturer shapes rider experience as much as your design does. Choose well.
Prototyping and Sample Iteration Process
Your first sample won't be perfect. Accept that now.
The prototype phase separates brands that get product development from those who hope for magic. You're building something physical. Real bodies will wear it through real rides. Testing, feedback, and refinement make this happen.
The Six-Step Iteration Framework
Step 1: Establish your question . What are you solving for? "Does this chamois position work for riders under 5'4"?" gives you an answer. "Is this a good design?" doesn't. Specific questions give you useful data.
Step 2: Make a plan . Who tests it? How many wearers? What conditions? A 30-minute spin class doesn't show what happens at mile 40. Plan tests that match real use.
Step 3: Build your prototype . Start simple. One fabric weight. One fit iteration. Save multi-version testing for later. Get something rideable first.
Step 4: Test and measure . Track both numbers and feelings. Seam placement causing rubbing at kilometer 25? That's data. Riders saying the jersey "just feels right"? Also data. Capture everything.
Step 5: Assess results . Check your findings against your original question. Did the chamois work? Did the fabric breathe? Be honest about failures. They cost less now than after production.
Step 6: Iterate . Adjust the prototype based on what you learned. Then cycle back through steps 4-6. Stop once the answer to your question is "yes."
What to Measure (and How)
Quantitative metrics give you numbers:
- Fabric stretch recovery after 50 wash cycles
- Moisture-wicking speed (time to dry post-ride)
- UV protection degradation over time
- Seam strength under stress testing
Qualitative feedback tells you the story:
- Where does discomfort appear during rides?
- What makes riders reach for this kit versus others?
- Which features go unnoticed (good) versus which annoy (bad)?
Use A/B testing for two strong options. Put chamois design A on one group. Design B on another. Same ride, same conditions. The data decides.
Cohort analysis tracks how different rider types respond. Your 5'2" testers might love the fit. Your 5'10" riders might report issues. That's not a failure. It's information about your size grading.
Iteration Speed vs. Quality
Fast-changing markets demand quick cycles. Competitors launch. Trends shift. But rushing past critical testing creates expensive mistakes.
Balance comes from focusing each iteration. Test one variable at a time where you can. Changed the chamois density AND the leg length AND the fabric weight? You won't know which change caused which result.
The right iteration frequency depends on your timeline and budget. Pre-launch brands might run 3-5 prototype rounds over 4-6 months. Established brands adding new styles might compress this to 2-3 rounds in 8 weeks.
Common Prototype Pitfalls
Making first versions too complex : Your first prototype doesn't need every feature. Test core fit and function first. Pockets, reflective details, special trims come in round two.
Skipping diverse body testing : Samples that work on athletic 5'6" riders might fail on 5'1" or 5'11" bodies. Test across your intended size range from day one.
Ignoring manufacturing reality : That hand-sewn detail your sample maker created? Can the factory copy it at scale? Check production feasibility during prototyping. Don't wait until after you've finalized designs.
Rushing to say "done" : Each iteration should answer specific questions. It should meet defined criteria. "Good enough" thinking here creates "not good enough" products later.
Your prototype phase isn't about perfection. It's about learning fast. Failing cheap. Building confidence that your final product will work. Take the time. Ask the questions. Listen to the data.
Production Timeline and Quality Control
Production schedules slip. Quality issues pop up mid-run. Your launch date gets closer while samples sit in revision. Sound familiar?
Custom cycling apparel needs precise timing and strict quality standards. Miss either one? You'll be explaining delays to angry customers or handling returns that kill your profit margins.
Timeline Metrics That Matter
Schedule Attainment shows you everything about how well you control operations. Track this: (Actual production completed / Planned production) × 100. Top cycling apparel's manufacturers hit >95% . Below 90% signals chaos—material delays, capacity problems, or poor planning.
Manufacturing Cycle Time breaks down where your weeks go:
- Process time (cutting, sewing, printing)
- Inspection time (quality checks at each stage)
- Move time (transfer between work stations)
- Queue time (waiting for next production step)
That "6-week lead time" your manufacturer quoted? It likely includes 2 weeks of queue time. Ask for the breakdown. Push them to cut queue and move time. Process time stays fixed. The rest? You can negotiate.
Order Fulfillment Lead Time measures customer promise to delivery. For custom women's cycling kits, 8-12 weeks is standard for first orders. Reorders should drop to 4-6 weeks since design is locked.
Quality Control That Catches Problems Fast
First Pass Yield separates good factories from great ones. This tracks products passing quality checks on the first try—no rework needed. Aim for 95%+ . Lower means they're catching problems late or missing them.
Six Sigma defect standards set the bar at ≤3.4 defects per million opportunities . Sounds extreme for cycling jerseys? It's not. One wrong seam ruins a chamois. One dye lot mismatch makes your team kit worthless.
Use Statistical Process Control (SPC) in real-time:
- Pull data from production lines without delay
- Watch for changes before they become disasters
- Fix things right away once metrics drift
- Document everything for ISO compliance
The Numbers You Can't Ignore
Scrap Rate shows material waste from defects. Keep this under 3% . Higher rates mean poor patterns or quality failures during cutting and sewing.
Supplier Defect Rate tracks problems from fabric or component suppliers. Check incoming materials. One bad chamois supplier can wreck your entire line's reputation.
Return Material Authorizations (RMAs) count products coming back for rework or disposal. Track both number and percentage. A spike here? You missed something in quality control.
Building Your Quality Audit System
Sample batches at set times and random points. Set checks catch big issues. Random checks stop people from gaming the system.
Use Pareto charts to find your top defect causes. 80% of quality problems come from 20% of causes . Fix those first.
Check these specific metrics:
- Cycle time per garment type
- Defect rates by production stage
- Scrap percentages by fabric type
- First-pass yield by operator or line
Set up data collection to run on its own. Modern factories pull numbers straight from machines and vendor systems. Real-time dashboards win over reports you see once a week.
Setting Realistic Benchmarks
Get historical data from your manufacturer. Look at season, fabric type, and order complexity. Find patterns. Winter orders with heavier fabrics might take 15% longer than summer jerseys.
Set SMART goals : Specific (reduce seam defects to <2%), Measurable (track per 1000 units), Attainable (based on past performance), Relevant (impacts customer satisfaction), Time-bound (achieve within 3 months).
Check these every three months. Markets shift. Tech gets better. Your benchmarks should get tighter over time.
The Cost Reality
Cost of Goods Sold (COGS) should stay ≤65% of revenue for healthy margins. This covers materials, labor, quality control, and waste. Top performers keep this stable even as they grow.
Cost of Quality adds up fast: prevention costs (training, process design), appraisal costs (inspection, testing), internal failure costs (scrap, rework), external failure costs (returns, warranty claims).
Track Customer Satisfaction Rate : (Goods delivered without complaints or returns / Total goods delivered) × 100. Survey customers on a regular basis. Repeated complaints show quality gaps your internal metrics missed.
Production timelines get squeezed under pressure. Quality standards can't bend. Build extra time into schedules. Put money into real-time monitoring. Catch defects before they reach riders. Your brand depends on it.
Branding, Labeling and Packaging Strategy

Your jersey arrives. The rider pulls it from the box. Those first five seconds? They shape everything that follows.
70% of consumers make buying decisions based on packaging alone . They judge your brand before feeling the moisture-wicking fabric or testing the fit. The label. The fold. The tissue paper. The box itself. These elements are your silent sales team.
Labels That Build Trust
Woven labels inside the collar show permanence. Heat-transfer labels feel modern. They avoid neck irritation during long rides. Pick the method that fits your brand position.
Include these details:
- Size information (use both numeric and descriptive sizing)
- Care instructions for sublimation printing and technical fabrics
- Fabric composition (required in most markets, builds trust)
- Country of manufacture
- Brand logo or name
86% of shoppers demand clear labeling . They want to know what they're buying. QR codes on hang tags solve the space problem. Link to detailed care guides, your brand story, or fit videos. 30% of consumer brands plan QR or NFC adoption by 2026 .
Packaging That Performs
The custom packaging market hit $43.88 billion in 2023 . It's growing at 5.32% each year . Why? Presentation drives value.
Consumers pay up to 25% more for products with premium packaging. Not luxury excess. Just thoughtful, quality presentation.
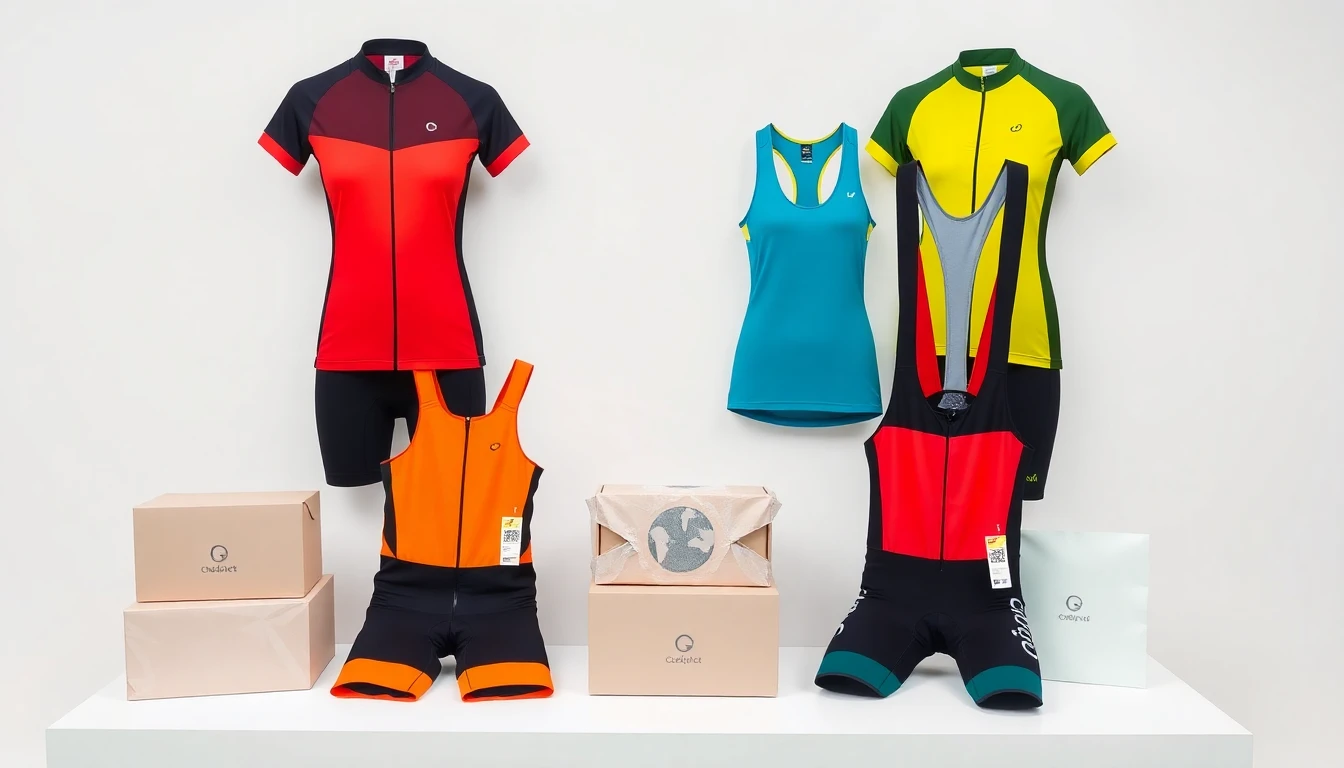
For cycling apparel:
Reusable mesh bags work great. Riders use them for laundry or packing kits for races. Your brand stays visible in their gear bag for years.
Minimalist boxes with custom tissue paper balance protection with green values. They ship well. They look sharp on unboxing videos.
Compostable mailers suit direct-to-consumer shipments. Plant-based materials show environmental care. They protect products during shipping.
90% of consumers favor brands with sustainable packaging . 43% will pay more for it. This is market reality. Major cycling apparel retailers now require sustainable packaging for shelf space.
The Unboxing Experience
78% of packaging producers saw e-commerce business rise in 2024. Over half now design for shipping. Your package needs to survive the journey. It needs to impress on arrival.
Layer your presentation:
1. Outer shipping box (plain or branded)
2. Tissue paper or branded wrapping
3. Product folded to show logo/key design element
4. Hang tag with QR code
5. Small insert card (care tips, brand story, discount code for next purchase)
48% of e-commerce packaging producers rank visual appeal as the top design driver. Instagram-worthy unboxing? It's organic marketing.
Smart Packaging Integration
Interactive elements connect physical product to digital experience. QR codes link to:
- Fit guides and sizing videos
- Fabric care tutorials for your materials
- Athlete stories or team features
- Green certifications and chain transparency
- Customer community (Strava club, Facebook group)
RFID tags protect brand integrity for higher-end lines. They verify authenticity. They enable inventory tracking. They make returns and warranty claims smoother.
Practical Implementation
Start simple. Test packaging with small production runs. Ask customers what they kept versus what they tossed.
Short-run custom labels enable seasonal variations. No massive minimums needed. Launch a limited colorway? Create matching hang tags. Regional team orders? Add location details.
Digital printing made visual enhancements affordable. Foil accents. Embossing. Special coatings. These weren't accessible at low volumes five years ago. Now they are.
Your packaging strategy should scale with your brand. Early-stage? Focus on clean, professional basics that ship well. Established brand? Layer in premium touches that justify higher price points.
The packaging and labeling services market reached $17.8 billion in 2025 . It's growing at 8.5% each year . This growth funds innovation. Better materials. Smarter integration. Sustainable options at competitive prices.
Your brand touches extend beyond the product. Labels show quality and compliance. Packaging creates memorable first impressions. Together, they turn one-time buyers into repeat customers. These customers tell their riding friends about that great kit they just got.
Building a Cohesive Product Line
A scattered product lineup confuses buyers. It drains your resources too. Three jerseys in clashing colors. Bib shorts that don't match anything. A vest that looks like it came from another brand.
Your customers want complete kits—not mismatched gear they have to piece together.
The 3-Line Foundation
Start lean. Three core product families give you variety without chaos:
Performance Road Line : Aerodynamic jerseys, race-cut bib shorts women want for hard efforts, lightweight arm warmers.
All-Weather Training Line : Heavier jerseys with moisture-wicking fabric, thermal bib tights, wind vests.
Everyday Riding Line : Relaxed-fit jerseys, comfortable padded cycling shorts women can wear on coffee rides, casual caps.
Stick to 3-4 SKUs per line. That's 9-12 total products to launch. Enough to solve real problems. Not so many you lose control of inventory.
Cohesion Through Design DNA
Shared color stories tie everything together. Pick 4-5 core colors. Use them across all three lines in different mixes. Your Performance Road jersey in navy and coral? Those same colors show up as accent panels on your All-Weather vest.
Consistent graphic elements create instant recognition. A geometric pattern on your jerseys? It appears simplified on your bib straps. Your logo treatment stays the same across every piece.
Unified fit philosophy matters too. Women's bike jersey design should follow the same ease and dart placement across lines. Riders switching from training gear to race gear shouldn't feel like they're wearing a different brand.
The Three-Tier Pricing Ladder
Entry tier ($80-120): Basic jerseys and shorts in your Everyday line. Lower fabric costs. Simpler graphics. Standard features.
Core tier ($120-180): Your Performance and Training lines. Better fabrics with advanced moisture-wicking. Sublimation printing that pops. Smart cycling wear details.
Premium tier ($180-250+): Limited colorways. Imported Italian fabrics. Special features like laser-cut hems or bonded construction.
This structure gives different buyers a place to enter. Plus, it creates natural upsell paths.
Smart SKU Roles
Anchors drive margin and volume. Your best-selling performance jersey? That's an anchor. Stock it deep. Keep it stable season to season.
Breadth builders solve related problems. Arm warmers match your jerseys. Caps coordinate with team cycling kits women order for clubs.
Test items validate new ideas at low cost. Try a new chamois design via small-batch production. Introduce a bold graphic as a limited run. See what sticks before you commit inventory dollars.
Bundle Strategy That Converts
Starter Kit ($220): Entry-tier jersey + shorts + cap. Perfect for new riders or gift buyers.
Team Kit ($320): Mid-tier jersey + bib shorts women custom order for clubs + arm warmers. The core training setup.
Race Ready ($450+): Premium jersey + race shorts + vest + accessories. For serious athletes.
Bundles boost average order value. They also reduce decision fatigue. Riders get matched pieces that work together.
Metrics That Show What's Working
Track these each week:
Units sold per SKU : Spots winners and duds fast
Gross margin percentage : Protects you from price drops
Average order value : Shows if bundles and upsells work
Repeat purchase rate : Measures true product satisfaction
Stock turns : Shows slow inventory eating cash
Return rates by item : Flags fit or quality problems
The Refresh Rhythm
Core anchors : Update colorways once a year. Keep fit and features stable.
Test items : Rotate every 6-8 weeks . Move fast. Learn what resonates.
Seasonal additions : Launch 2-3 limited items per season around holidays or events.
Prune hard. An SKU selling fewer than 10 units per month? Cut it unless it serves a strategic purpose like completing a team kit.
Manufacturing Alignment
One to two cycling apparel's manufacturers for core lines creates consistency. Same sublimation process. Same quality standards. Delivery timing that lines up for bundle launches.
Save additional suppliers for test items. This keeps your anchors reliable while you experiment at the edges.
Your product line isn't everything you could make. It's the focused set of pieces that solve real rider problems while building a recognizable brand. Start tight. Expand based on data, not hunches.
Common Design Mistakes and How to Avoid Them
Bad data ruins good design faster than cheap fabric or sloppy stitching. You collect feedback from three riders and call it validated. You peek at sales numbers and panic-shift your whole color palette. You ignore the outlier complaint because it doesn't fit your narrative.
These research mistakes waste time. Worse, they create products riders won't wear.
The Sample Size Trap
Testing your chamois design on five riders feels thorough. It's not. Small samples cut your statistical power . You'll miss real problems. One vocal tester loves the padding depth? Great. But four others might tolerate discomfort without saying it ruins the ride.
The fix isn't simple math. Quadruple your sample size to halve your error rate . Want reliable feedback on bib shorts women custom designs? Test across body types, riding styles, and distances. Ten diverse testers beat twenty similar ones.
The Data Collection Problem
You collect feedback through different channels. Instagram DMs, email surveys, casual conversations. This creates inconsistent data. One tester rates comfort "8/10" via text. Another says "pretty good" on a call. You can't compare these.
Standardize your collection process . Use the same rating scale. Ask identical questions. Record responses the same way every time. Consistency reveals patterns instead of noise.
The Peeking Mistake
Your first 50 jerseys ship. Sales look slow. You tweak the homepage photos and pricing right away. Now you'll never know if the original approach would have worked. Checking results too soon inflates false positives . It derails your plan.
Set decision points before you launch. "We'll evaluate after 100 units sold" or "We'll review feedback after 30 days." Stick to it. Panic adjustments based on incomplete data create more problems than they solve.
Marketing Your Custom Women's Cycling Brand

The women's cycling market won't wait for you to catch up. USD 18 billion in 2025 . USD 25 billion by 2035 . That's 3.3% annual growth —steady, predictable growth driven by real changes in rider behavior.
More women cycle every year. Urban commuters need gear that works from bike lane to office. Recreational riders want kits that perform without looking too serious. Meet these riders where they are.
Target the Segments That Matter
Urban and commuter bikes hold 43% of the market . These riders don't train for races. They need transport for work and errands. Talk about weather protection, visibility features, and style that works off the bike.
Specialty retail controls 45% of distribution . Skip physical stores and you miss half your buyers. Partner with bike shops that get proper fit. Co-host events. Offer exclusive colors. Physical retail builds trust Instagram ads can't match.
Geographic Priority Makes Money
Asia Pacific owns 30.85% market share with the fastest growth at 6.47% CAGR . China, Japan, and India drive this growth. Ignore these markets and you lose major revenue.
North America takes 28.15% of the market— USD 2.22 billion in 2025. The US accounts for 78.46% of that region. Canada and Mexico add sales without new brand positioning.
Europe represents 26.80% . Germany leads at 33.1% regional share . The UK and France follow. These markets care about performance specs and eco-friendly messages. Match your brand story to what they want.
Marketing Angles That Convert
Women-focused community building beats generic cycling content. Partner with health groups. Sponsor local group rides. Create Strava clubs. Female participation grows at 1.4x market expansion —use that momentum.
Women-specific design isn't optional. Show off ergonomic fits, safety features, and styles made for female bodies. This focus drives 6% category growth on its own.
E-bike integration speeds up after 2030, creating 51.4% of late-period growth . Build compatibility now. Market your gear as e-bike ready.
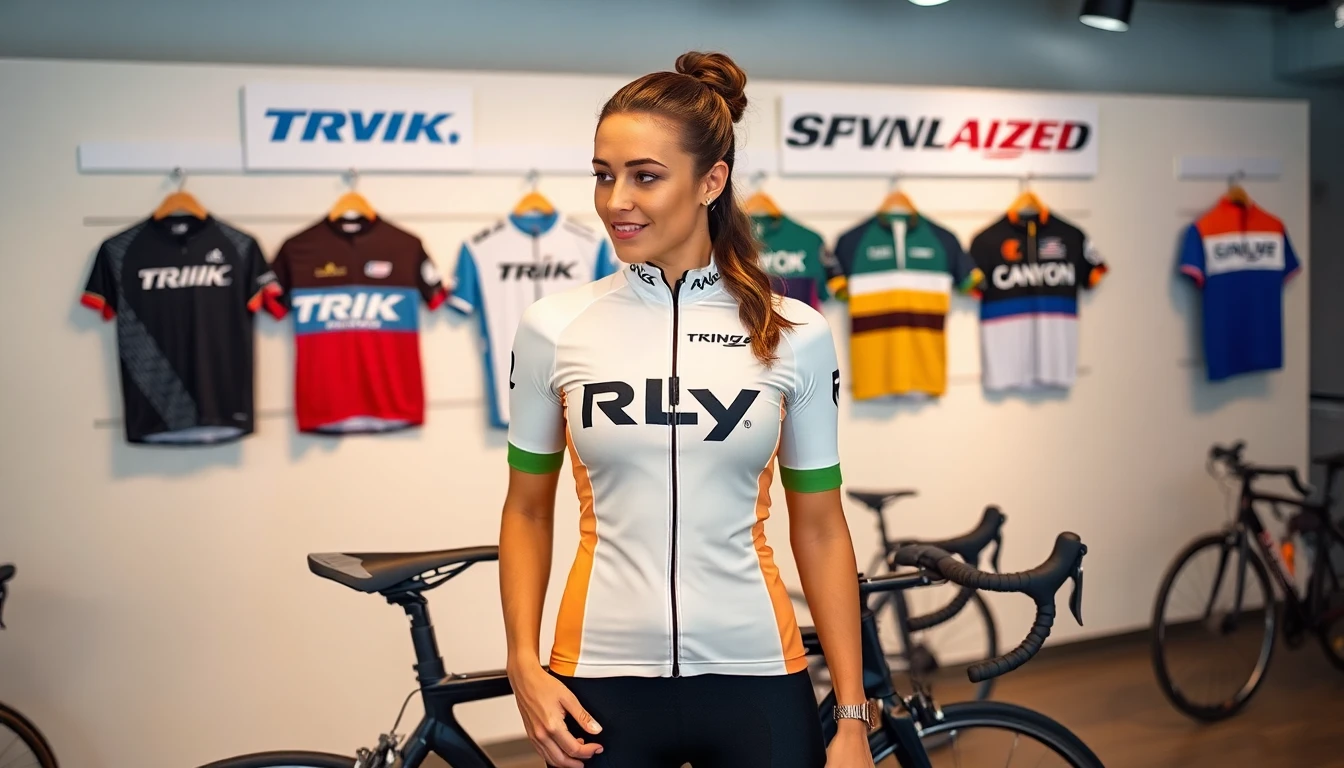
Track competitors—Trek, Specialized, Liv, Canyon—but don't copy them. Find what they're missing. Then own that space.
Conclusion
Designing custom women's cycling uniforms for your private brand goes beyond picking pretty colors and adding a logo. You're creating gear that serves female cyclists.
Select moisture-wicking fabric that performs under pressure. Perfect the ergonomic fit that flatters and functions. Each decision shapes your brand's identity. It also defines your customers' experience on the road.
The path from concept to production can feel overwhelming. But here's the truth: successful brands listen to their riders. They partner with manufacturers who get quality right. They iterate until the product works.
Your custom women's bike jersey should tell a story. One that resonates with your community. One that keeps them coming back.
Ready to bring your vision to life? Start with one killer piece. Test it with real riders. Build from there.
The cycling world needs more brands that understand what women want. Make yours one of them.
Your move : Reach out to experienced cycling apparel manufacturers. Request samples. Start the conversation that turns your design dreams into reality.